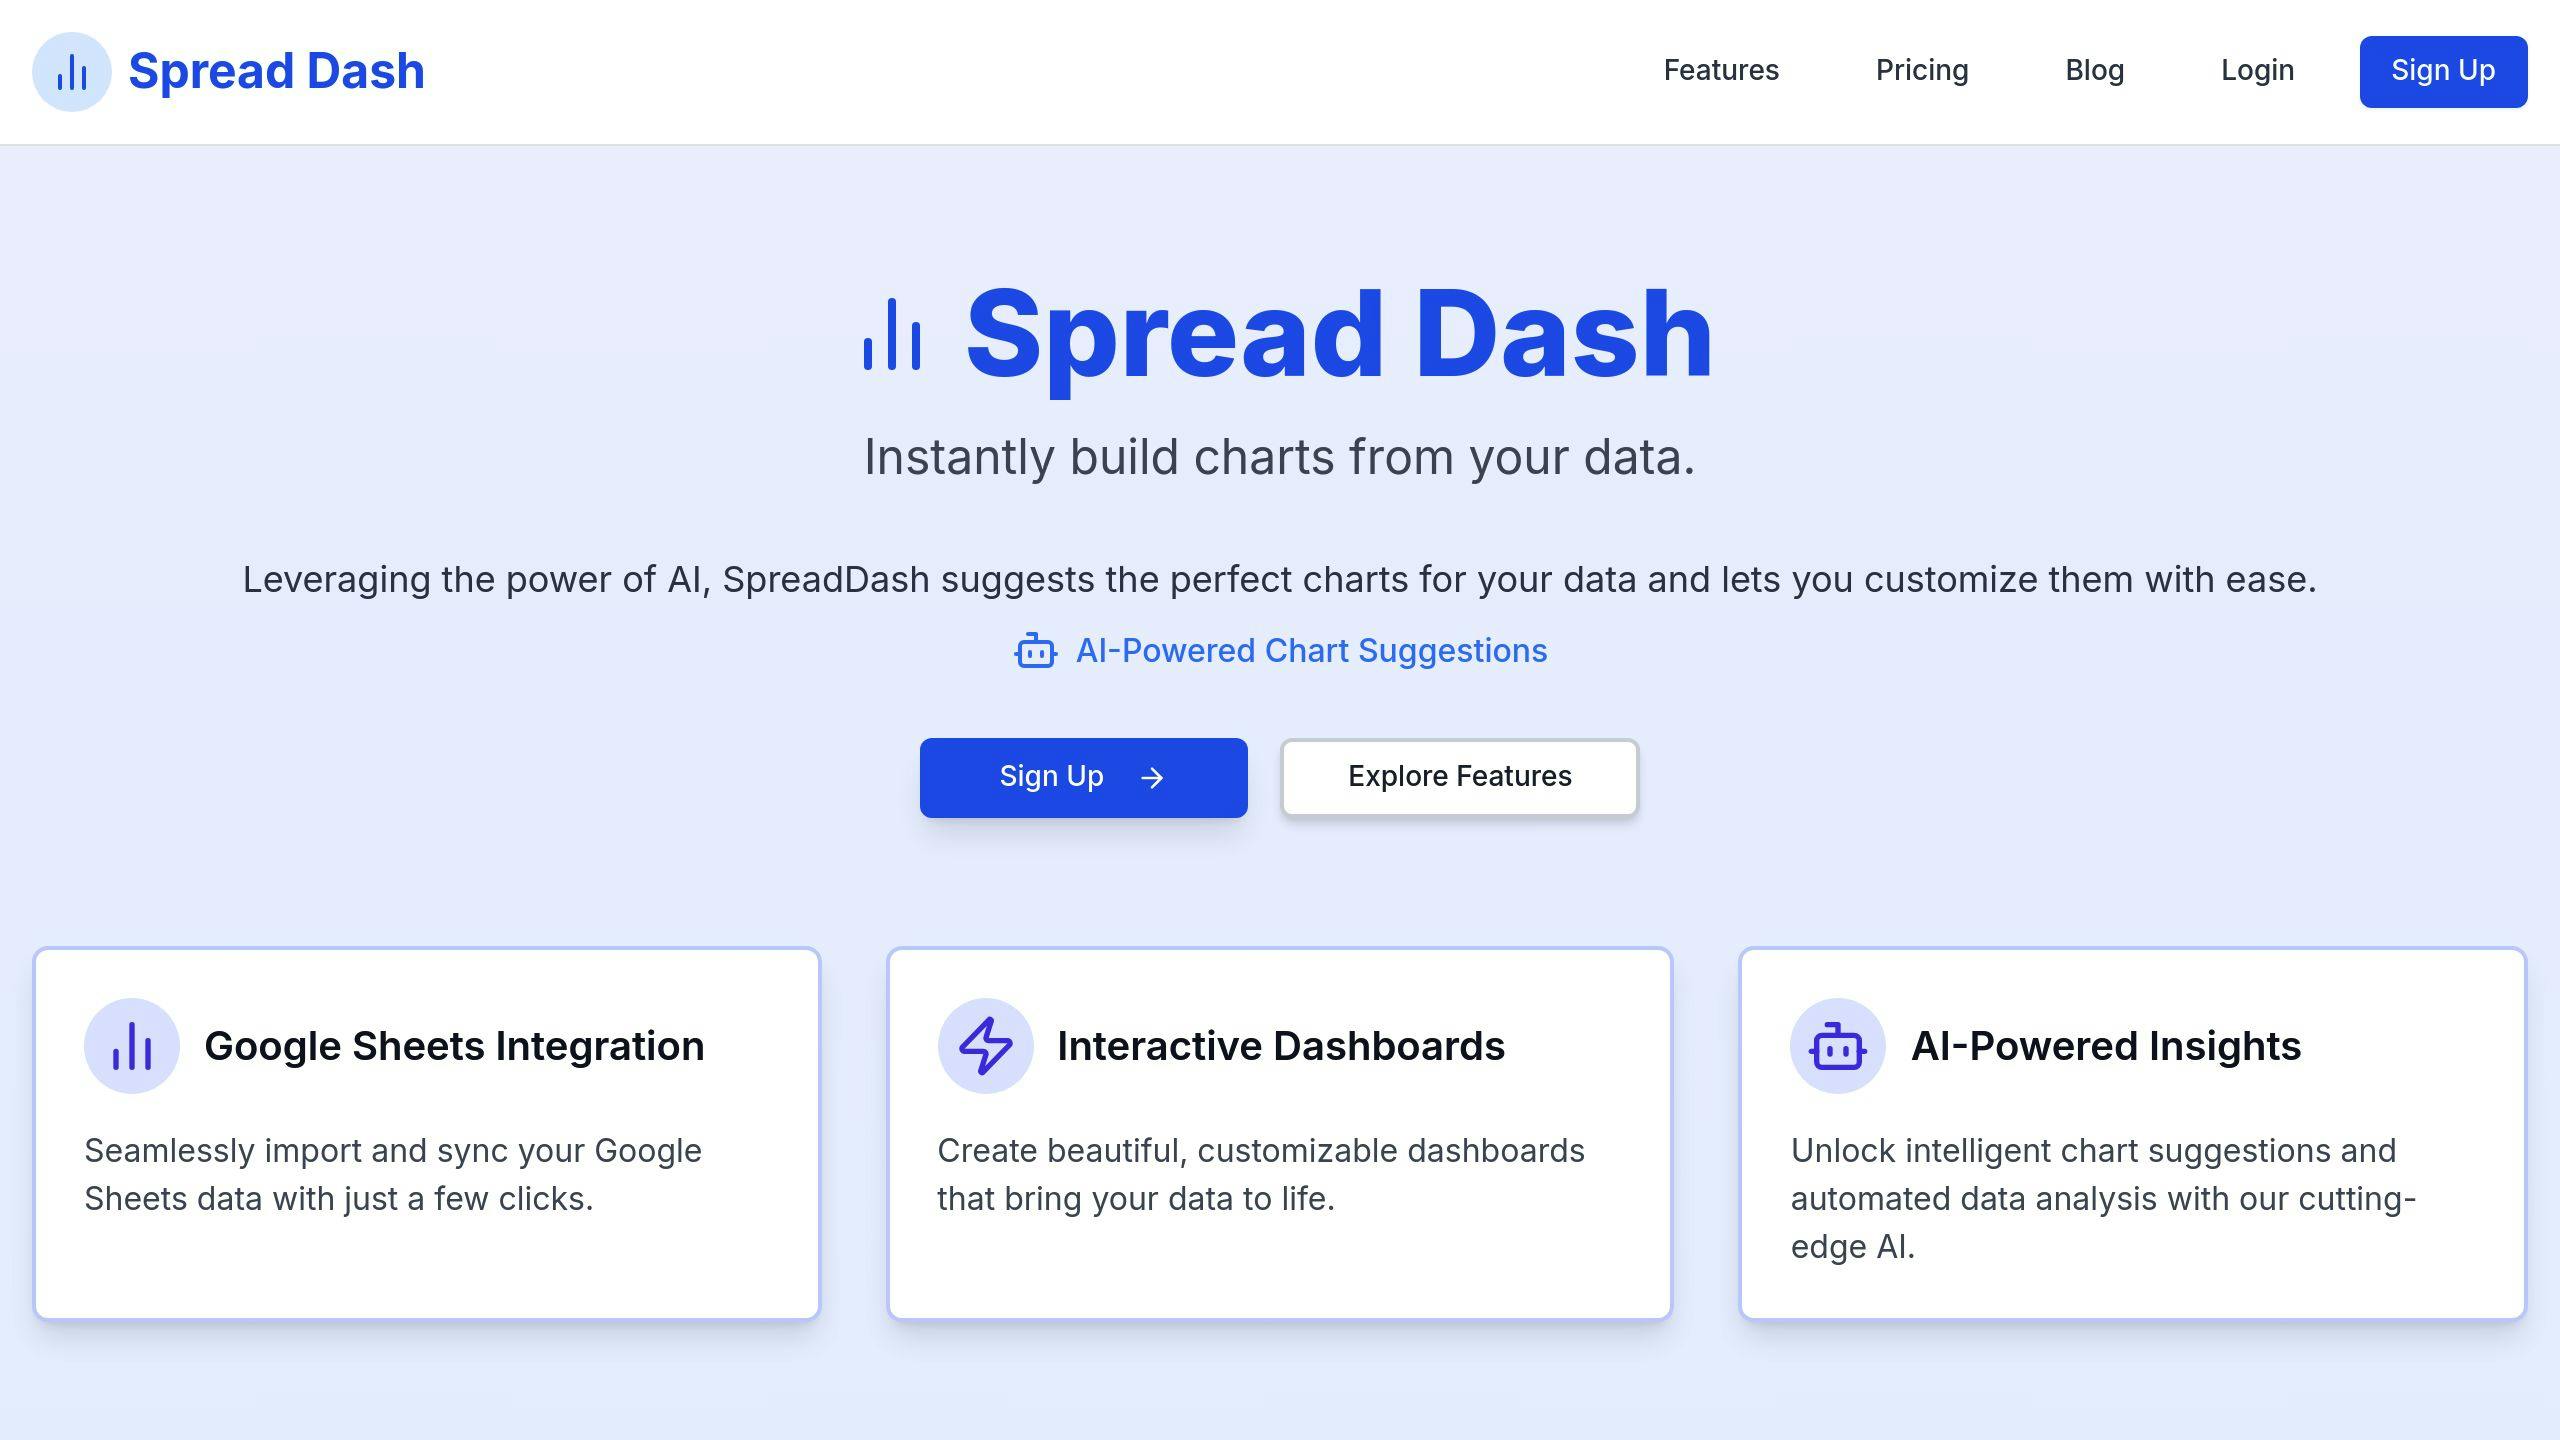
How to Build an EOS Scorecard with SpreadDash
An EOS Scorecard simplifies tracking key business metrics, aligning with the Entrepreneurial Operating System (EOS) framework. SpreadDash enhances this process by turning Google Sheets into interactive dashboards with real-time updates and AI-powered insights. Here's how to get started:
- Set Up SpreadDash: Create an account, connect Google Sheets, and import your data. Plans include Free (10 charts), Pro ($10/month, 100 charts), and Enterprise (1,000 charts).
- Choose Metrics: Focus on 5-15 key metrics, like financial health, customer acquisition, or operational efficiency.
- Design Your Scorecard: Use a 13-week Google Sheets template with columns for metric titles, goals, owners, and results.
- Visualize with SpreadDash: Leverage AI for chart suggestions (e.g., bar, line, area charts) and customize dashboards for clarity.
- Automate and Review: Enable automated data refreshes and conduct weekly meetings to track progress and adjust goals.
Quick Comparison: Traditional Methods vs. SpreadDash

| Feature | Traditional Methods | SpreadDash |
|---|---|---|
| Data Updates | Manual | Real-time, automatic |
| Visualization | Static charts | Interactive, AI-recommended |
| Accessibility | Local-only access | Cloud-based |
| Integration | Separate systems | Google Sheets connection |
| Analysis Tools | Basic calculations | AI-driven insights |
Start with SpreadDash’s free plan to explore its features and upgrade as your business grows. This tool makes building and maintaining an EOS Scorecard seamless, helping you focus on achieving your goals.
Related video from YouTube
Setting Up Your SpreadDash Account
Creating and Configuring a SpreadDash Account
Head over to spreaddash.com to set up your account. Once you've verified your email, pick a pricing plan that matches your business needs:
| Plan | Key Features | Best For |
|---|---|---|
| Free | 10 AI-Based Charts, 2 Sheets | Small teams starting EOS |
| Pro | 100 AI-Based Charts, 10 Sheets | Growing businesses |
| Enterprise | 1000 AI-Based Charts, 50 Sheets | Large organizations |
These options let you customize your account to handle EOS Scorecard creation and management effectively.
Connecting Google Sheets to SpreadDash
Go to the "Data Sources" section in your dashboard and select Google Sheets. Follow the steps to authorize access. SpreadDash uses top-level security to keep your data safe. Make sure your sheets have clear headers, consistent formatting, and the right team permissions to ensure smooth integration.
Importing Data from Existing Files
If you're switching from another tool, SpreadDash supports importing data from Excel and CSV files. Double-check your file formatting, map the columns correctly, and enable automated updates to keep your data accurate and up-to-date.
Once your account is set up and your data is in place, you’re ready to start building an EOS Scorecard that fits your business goals.
Designing Your EOS Scorecard Structure

Pinpointing Metrics That Matter
Start by narrowing down to 5-15 activity-based numbers that directly impact your business performance.
"Our EOS Scorecard helps leadership monitor progress toward financial goals", says David Tramontana, FocusCFO Integrator.
Here are some key metric categories to consider:
| Category | Example Metrics | Purpose |
|---|---|---|
| Financial | Working Capital, Cash Flow | Keep an eye on financial health |
| Customer | Acquisition Cost, Retention | Understand customer dynamics |
| Operational | Inventory Turnover, Lead Time | Assess internal processes |
Once you've chosen the right metrics, the next step is to organize them into a clear, actionable scorecard.
Building a Scorecard Template in Google Sheets
Set up a 13-week template in Google Sheets. Include columns for Owner, Metric Title, Weekly Goal, Unit, Data Source, and Results. Use conditional formatting - like green for on-track and red for off-track - to make performance trends stand out at a glance.
Structuring Metrics for Clarity
To make your scorecard more effective, divide your metrics into two main types:
Leading Indicators
These predict future outcomes and help you act proactively:
- Sales meetings conducted
- Website traffic patterns
Trailing Indicators
These reflect past performance and show results:
- Revenue growth
- Operating cash flow
Balancing these two types ensures you’re tracking both progress and results. Stick to metrics that are easy to pull from existing tools like CRM reports or financial software.
With your metrics sorted, you can move on to turning them into interactive visualizations using SpreadDash.
Building Interactive Visualizations with SpreadDash
Using AI-Powered Chart Suggestions
SpreadDash uses AI to analyze your data and suggest the most effective chart types for presenting it clearly. It tailors these recommendations to your EOS metrics, ensuring your visuals communicate insights effectively.
| Metric Type | Recommended Visualization | Best For |
|---|---|---|
| Weekly Sales | Bar + Line Chart | Comparing targets vs. actuals |
| Cash Flow | Area Chart | Tracking cumulative changes |
| Customer Metrics | Column Chart | Period-over-period analysis |
| Team KPIs | Gauge Charts | Real-time performance tracking |
Customizing Charts and Graphs
Making adjustments to your charts helps align your EOS scorecard with your team’s specific needs. If you’re on the Pro plan ($10/month), you can save custom themes to reuse across multiple scorecards.
Here are a couple of tips to enhance your visualizations:
- Add color coding, annotations, and interactive tooltips to emphasize key trends and provide extra context.
- Enable time range selectors to easily switch between weekly, monthly, or quarterly views.
Creating a Dashboard Layout
For an organized and easy-to-navigate dashboard, divide it into three main sections:
- Place key performance indicators (KPIs) at the top for quick, high-level insights.
- Use the middle section for departmental metrics to track team-specific progress.
- Reserve the bottom for supporting data to dive into detailed analysis.
Consistency is key - stick to uniform chart styles and filters to maintain clarity. Once your visuals are set up, focus on keeping your EOS scorecard actionable by updating and reviewing it regularly.
Implementing Weekly Reviews and Updates
Setting Up Automated Data Refresh
SpreadDash offers an automated refresh feature to keep your EOS scorecard updated with the latest data. If you're on the Pro plan ($10/month), head to the dashboard settings, select "Data Sources", and choose how often you'd like the data to refresh - hourly, daily, or weekly. You can also enable email alerts to notify you if any updates fail.
To get the most out of this feature, set the refresh schedule to update before your weekly review meetings. This ensures your team is working with the most current information. The Pro plan supports up to 10,000 rows of data, giving you plenty of room to manage your metrics.
Once automated updates are configured, you'll have real-time data ready for your weekly reviews.
Conducting Weekly Scorecard Review Meetings
A well-structured meeting helps you get the most out of your EOS scorecard. Here's a suggested format for your weekly reviews with SpreadDash:
| Meeting Component | Duration | Purpose |
|---|---|---|
| Data Review and Analysis | 20 mins | Check data accuracy and address off-track metrics |
| Action Planning | 15 mins | Assign tasks and set goals for the next week |
Keep your SpreadDash dashboard open during the meeting to access real-time data and visual tools. The platform's interactive features make it easy to dive deeper into specific metrics when needed.
After analyzing performance, take time to refine metrics and goals to ensure they align with your business priorities.
Adjusting Metrics and Goals
As your business grows and changes, your EOS scorecard should evolve too. SpreadDash simplifies the process of updating your metrics. Here’s how you can keep your scorecard relevant:
- Regular Reviews: Every 90 days, review your scorecard alongside your quarterly EOS planning to confirm that your metrics are still aligned with your goals.
- Data-Driven Adjustments: Use SpreadDash's AI tools to pinpoint which metrics are driving results. Remove or replace metrics that aren’t offering actionable insights.
- Setting Goals: Leverage the platform’s trend analysis to create goals that are both realistic and challenging, based on past performance.
SpreadDash’s AI features make it straightforward to identify weak metrics and recalibrate your goals using historical trends, keeping your team on track.
Conclusion and Key Takeaways
Review of the EOS Scorecard Creation Process
Creating an EOS scorecard with SpreadDash is a step-by-step process that includes setting up your account, connecting data sources like Google Sheets, and using AI tools to generate clear visualizations. The platform simplifies tracking and updating metrics with its automation features and interactive dashboards.
Here’s what you need for a successful EOS scorecard:
- Data Integration: Centralize and organize your business metrics in one place.
- Visualization: Turn raw numbers into easy-to-understand visuals.
- Automation: Keep your metrics accurate and updated without manual effort.
- Review System: Regularly monitor and analyze progress to stay on track.
By following these steps, you can use SpreadDash to streamline your EOS scorecard process and focus on what matters most - your goals.
Start Using SpreadDash
Getting started with SpreadDash is quick and straightforward - perfect for completing in just a few hours. The platform makes business intelligence accessible to everyone, even those without technical expertise.
Begin with the free plan to explore its features, and upgrade to Pro for automated updates and more data capacity. Use AI-driven chart suggestions to design impactful visuals that match your metrics. SpreadDash also prioritizes data security and offers scalability, making it a great fit whether you're tracking sales goals or measuring customer satisfaction.
To make the most of your EOS scorecard, start with your most critical metrics and refine your dashboard over time based on your team's needs. SpreadDash’s customer support is there to help, ensuring your path to data-driven decisions is smooth and efficient.
FAQs
How to build an EOS scorecard?
Creating an EOS scorecard with SpreadDash involves combining metric selection, clear visualization, and automation. Here's how to do it:
-
Define Categories: Break down metrics into specific areas like Sales, Marketing, Operations, or Finance. Each department should have its own section on the scorecard.
-
Set Clear Targets: Establish measurable goals for each category. For instance, in sales, you might track weekly targets for leads, conversion rates, or revenue.
-
Choose the Right Metrics: Use the metrics you've outlined in your scorecard framework to monitor progress. SpreadDash streamlines this step by centralizing data, automating updates, and offering tools for tracking.
-
Assign Responsibility: Make team members accountable for specific metrics. They should regularly update data and participate in meetings to discuss results.
What is the EOS scorecard for business?
The EOS scorecard is a live dashboard featuring 5-15 activity-based metrics (called Measurables) that provide quick insights into performance [2]. SpreadDash allows businesses to upgrade these static scorecards into interactive, real-time dashboards.
Key features include:
- Future-Focused Metrics: Unlike traditional reports that look at past performance, EOS scorecards emphasize weekly goals and upcoming outcomes [1].
- Actionable Data: Metrics should be activity-based and within your team's control to drive change.
- Consistent Reviews: Regularly reviewing the scorecard ensures everyone stays aligned with business goals.
SpreadDash takes this further by offering:
- AI-powered chart recommendations for better visualization
- Automated data updates
- Real-time collaboration via Google Sheets integration
- High-level security to protect sensitive business information
